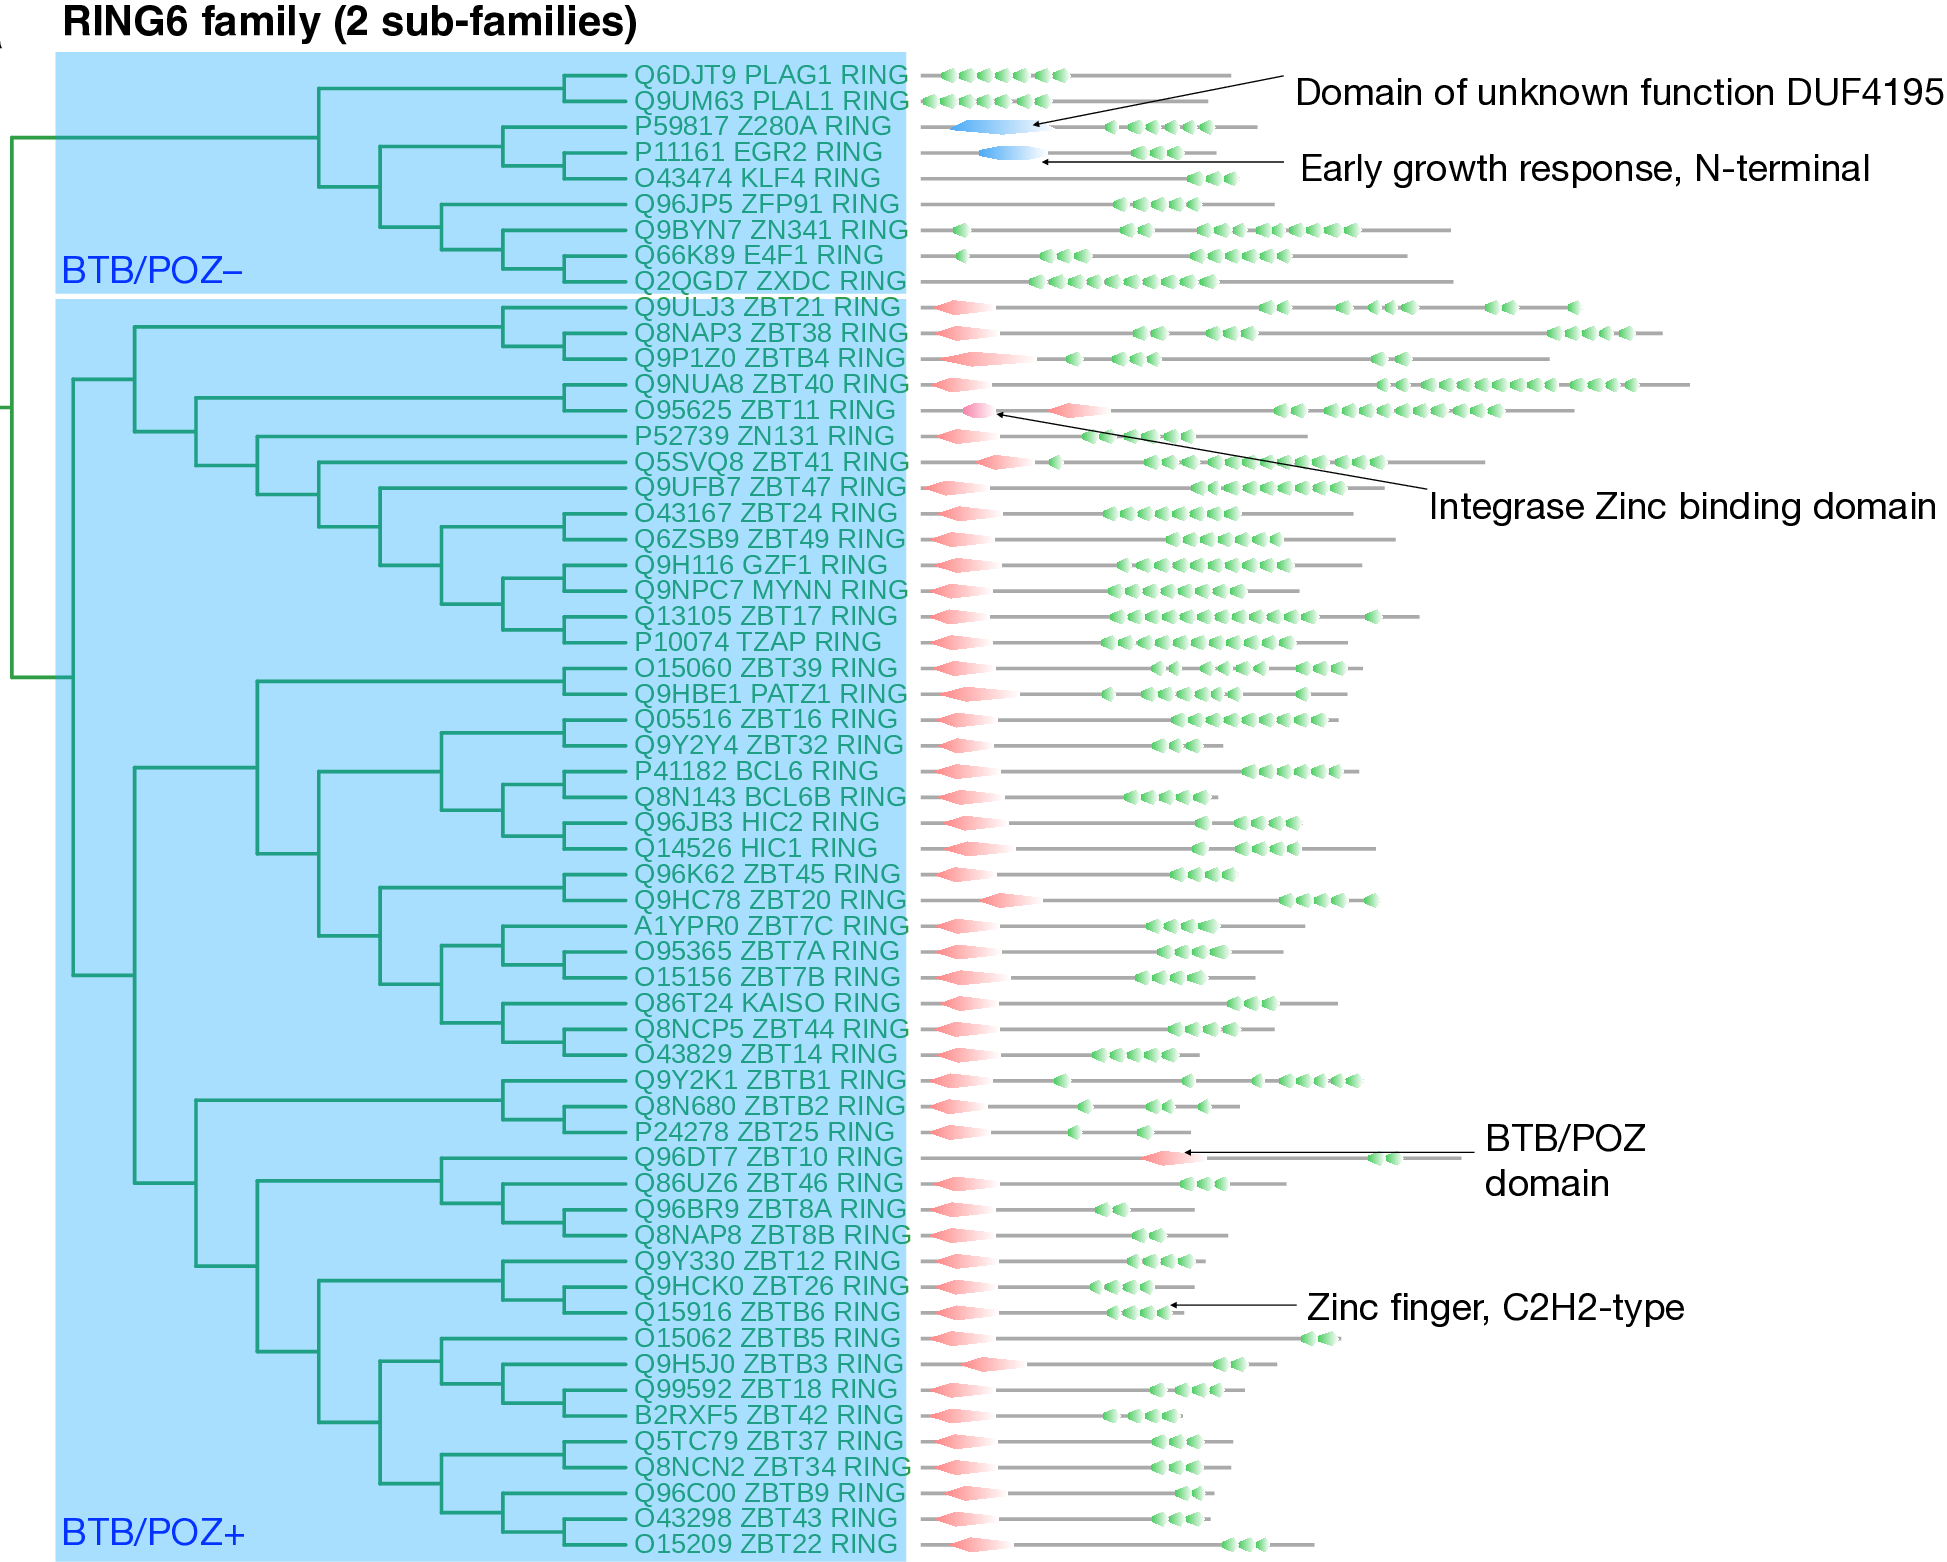
The RING6 family consists of 58 E3s, characterized by tandem repeats of Zn-finger C2H2-type catalytic (IPR013087) domains, often near the C-terminus. This well-studied Zn-finger domain contains two segments with two cysteines and two histidines (C2H2) coordinating the Zn in a tetrahedral geometry. This functional domain recognizes and binds to nucleic acids and proteins. Additionally, more than 80% of them contain the BTB/POZ domain (Broad-Complex, Tramtrack, and Bric-à-brac; and Poxvirus and Zn-finger; IPR000210.
The N-terminal BTB/POZ domain is essential for protein–protein interactions, facilitating the formation of homo- and hetero-dimers, interactions with transcription factors, and recruitment of CUL3-based E3 complexes. Consequently, at the molecular function level, we observe enrichment for mediation of DNA binding transcription repressor activity, methyl CpG binding, and DNA binding transcription activator activity.
The multiple-sequence alignment of the RING6 family shows the conservation of the C-terminal Zn-finger C2H2 domain repeats and the N-terminal BTB/POZ domain.
The RING6 family is segregated into two distinct subfamilies based on BTB/POZ domain presence. The subfamily without the BTB/POZ domain (BTB/POZ–) encompasses nine E3s, including PLAG1 and PLAL1, which feature N-terminal C2H2-type Zn-finger domain repeats. Additional members such as Z280A and EGR2 possess N-terminal DUF (Domain of unknown function) and early growth response domains, facilitating homodimerization and nucleic acid binding. Overall, RING6 members are enriched in specific biological processes such as hemopoiesis, negative regulation of cell population proliferation, and differentiation of fat cells.
The PDB contains 172 resolved structures, covering 15/58 RING6 proteins. Fourteen RING6 family proteins are likely to function as complex ligases; however, other proteins remain unclassified. Analysis of the ESI network for this family revealed 23 unique E3-specific substrates and seven family-specific substrates. We detected 161 compounds binding to BCL6, clustered into three groups. These represent the potential for the rational design of E3 handles and PROTACs.
For updated information and bibliography, please consult the supplementary information in Dutta et al. (2025, preprint)
The values represent E3 ligase confidence scores, calculated as the fraction of databases that annotate the protein as an E3 ligase (see preprint).