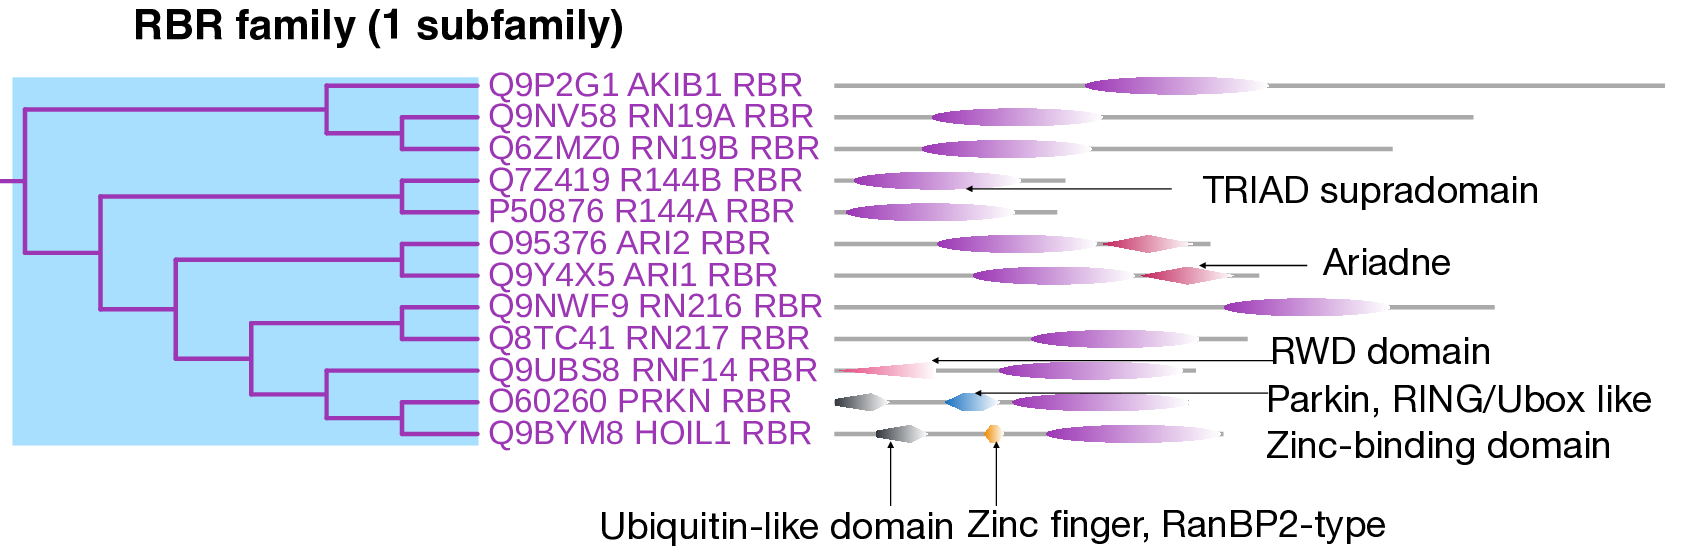
The RBR family is organized into a single subfamily composed of 12 RBR E3 ligases, typically exceeding 700 residues in length. Members of this family are characterized by the catalytic TRIAD supra-domain (IPR044066), which comprises the RING1, BRcat (IBR), and Rcat (RING2) domains. This conserved architecture of domains is typical among eukaryotic RBR E3 ligases. The TRIAD domain is observed at the C-terminal region of RN216, RN217, RNF14, PRKN, and HOIL1, which are multi-domain proteins that also contain Ariadne, Parkin, RING Ubox-like zinc-binding, and Zn-finger RanBP2-type domains.
Interestingly, the RBR cluster excludes CUL9 (UniProt Q8IWT3) and RNF31 (UniProt Q96EP0), which are clustered within the HECT2 and RING7 families. HHARI (ARI1) and TRIAD1 (ARI2) contain an Ariadne domain (IPR045840) at the C-terminal. RNF14 has an RWD domain (IPR006575) at the N-terminal. PRKN and HOIL1 include ubiquitin-like domains at the N-terminal, followed by Zn-finger domains—specifically, a RING/Ubox-like zinc-binding domain in PRKN and a RanBP2-type domain (IPR001876) in HOIL1. The MSA confirms the conserved TRIAD supradomain as the characteristic feature of this family.
These ligases utilize a two-step catalytic mechanism where RING1 recognizes the E2–Ub conjugate, transfers the ubiquitin to a conserved catalytic cysteine on RING2 to form a thioester intermediate, and subsequently transfers the ubiquitin to the lysine residue of the substrate. Functionally, RBR ligases are involved in oncogenesis and tumor-suppressive roles.
Enrichment analysis reveals associations with biological processes such as protein K6-linked ubiquitination, protein polyubiquitination, and general protein ubiquitination. They localize to ubiquitin ligase complexes, and their molecular functions include ubiquitin-conjugating enzyme binding, ubiquitin-like protein binding, and transcription coregulator activity. The PDB contains 38 structures covering 6 out of 12 RBR proteins.
The plausible mode of action for RBR E3 ligases indicates that most function as standalone ligases, while PRKN, ARI1, and ARI2 may act as complex E3 ligases. Analysis of the ESI network for this family revealed 101 unique E3-specific substrates and 65 family-specific substrates. We identified one small molecule binder for HOIL1, which could be developed into an E3 handle for HOIL1 and repurposed for PRKN and other co-clustered E3s.
For updated information and bibliography, please consult the supplementary information in Dutta et al. (2025, preprint)
The values represent E3 ligase confidence scores, calculated as the fraction of databases that annotate the protein as an E3 ligase (see preprint).